
Have you ever felt exhausted, only to see a relatively normal HRV score the next morning? Or had a lower-than-usual HRV reading on a day when you actually felt fine?
There is a simple reason this can happen: one HRV number cannot describe everything happening between your heartbeats.
HRV is built from the variation between successive heartbeats. A single metric such as RMSSD can summarize part of that variation, but it does not show how the rhythm changes from beat to beat.
That is where HRV rhythm patterns and visual tools such as the Lorenz plot, also known as a Poincaré plot, become useful.
Instead of looking at one number, you can visualize how individual heartbeat intervals relate to one another. The resulting pattern can provide another way to understand changes in your autonomic regulation and recovery-related physiology.
In this article, we'll explain what a Lorenz plot is, how it is constructed, what its basic patterns can tell you, and why continuous HRV data can provide more context than a single daily score.
Key Takeaways
A single HRV score summarizes part of your heart rhythm, but it does not show every beat-to-beat change.
A Lorenz plot (Poincaré plot) turns successive heartbeat intervals into a visual pattern, making changes in rhythm easier to see.
The width and overall distribution of the plot can provide information about short- and longer-term heart rate variability.
Different patterns may reflect differences in autonomic regulation, but a Lorenz plot should be interpreted in context rather than treated as a diagnosis.
Continuous and consistent data can make it easier to observe changes in your HRV patterns over time.
The CIRCUL RING 2 MAX provides true 24/7 continuous monitoring of HR and HRV, supporting long-term observation of physiological patterns.
Wearable HRV data is best used as wellness and lifestyle insight, not as a replacement for professional medical evaluation.
Why a Single HRV Score Isn't Enough
The Problem with Averaging Your Heartbeat
Most wearable devices present HRV as a number.
One commonly used metric is RMSSD, which looks at changes between successive heartbeat intervals over a defined measurement period. That number can be useful. But like any summary metric, it leaves out information.
Imagine looking at the closing price of a stock and trying to understand everything that happened during the trading day. You know where the day ended, but you cannot see every rise and fall along the way.
HRV works in a similar way. A single value summarizes a period of heartbeat data, but it does not show exactly how that rhythm changed throughout the recording.
This matters because your autonomic nervous system is constantly responding to changes in activity, rest, sleep, stress, and other conditions. Your heartbeat does not simply maintain one fixed rhythm throughout the day.
RMSSD Has Context, Too
RMSSD is particularly useful for looking at short-term changes in HRV, but it should not be interpreted in isolation.
Its relationship with heart rate is one reason context matters. Differences in mean heart rate can influence RMSSD, which means that two people—or even the same person under different conditions—can produce different RMSSD values without the difference necessarily representing a major change in autonomic function.
Recording quality matters as well. HRV calculations are based on heartbeat intervals, so missed beats, extra beats, movement, or other artifacts can affect the resulting value.
In other words: An HRV number is only as useful as the data and context behind it. That is why looking at patterns can add another layer of information.
What a Score Hides: The Need for Visual Patterns
Different HRV metrics describe different aspects of heart rhythm.
Feature |
SDNN |
RMSSD |
|---|---|---|
Main focus |
Overall variability across a recording period |
Short-term beat-to-beat variability |
Time scale |
More useful for longer recording periods |
More responsive to short-term changes |
Common interpretation |
Broader measure of overall HRV |
Often used as a short-term HRV indicator |
Practical use |
Useful for looking at longer-term patterns |
Useful for observing short-term changes |
The important point is not that one metric is always better than another, they answer slightly different questions: SDNN provides a broader view of variability across a recording period. RMSSD focuses more closely on short-term changes between successive beats.
But neither metric directly shows the shape of the underlying heartbeat pattern, that is where a visual approach becomes useful.
A Lorenz plot allows you to look at the relationship between successive heartbeat intervals rather than reducing the entire recording to a single number.
Understanding Common Lorenz Plot Patterns
Once heartbeat intervals are plotted, different distributions can appear.
You may see a relatively compact, elongated shape, a broader distribution, or a more scattered pattern.
These shapes are sometimes described using visual terms such as comet, torpedo, or fan. Rather than simple health scores, these labels should be treated as more as descriptive patterns.
Visualizing Heartbeat Dynamics: The Lorenz Plot Explained
What Is a Lorenz Plot?
A Lorenz plot, also commonly called a Poincaré plot, is a way of visualizing successive RR intervals, it simply means the time between two consecutive heartbeats.
For each heartbeat, one interval is plotted against the previous interval. Thousands of these points can then form a characteristic cloud or shape. You can think of it as turning a stream of heartbeat intervals into a picture.
Instead of seeing: HRV = one number, you will see: How does one heartbeat interval relate to the next? That visual relationship can reveal features of the rhythm that are difficult to see in a simple average.
How Is a Lorenz Plot Constructed?
Imagine that your heartbeat intervals are: 800 ms → 820 ms → 790 ms → 810 ms → 805 ms.
The plot compares each interval with the one immediately before it. One point represents the relationship between 800 and 820 ms. The next represents 820 and 790 ms. The process continues throughout the recording.
As more beats are added, the individual points form a recognizable distribution. This is why accurate heartbeat detection matters. If the underlying RR intervals contain significant errors or artifacts, the visual pattern can also be distorted.
Why Continuous Data Matters
A meaningful Lorenz plot requires enough reliable heartbeat data to show the underlying pattern.
If a wearable only collects occasional heart-rate samples, it has fewer heartbeat intervals available for this type of analysis.
By contrast, true continuous HRV monitoring provides a much denser stream of physiological data.
This does not mean that more data automatically produces a better interpretation. It means that fewer gaps give you more information about how your heart rhythm changes across the recording period. For long-term wellness tracking, that distinction can be valuable.
Understanding Common Lorenz Plot Patterns
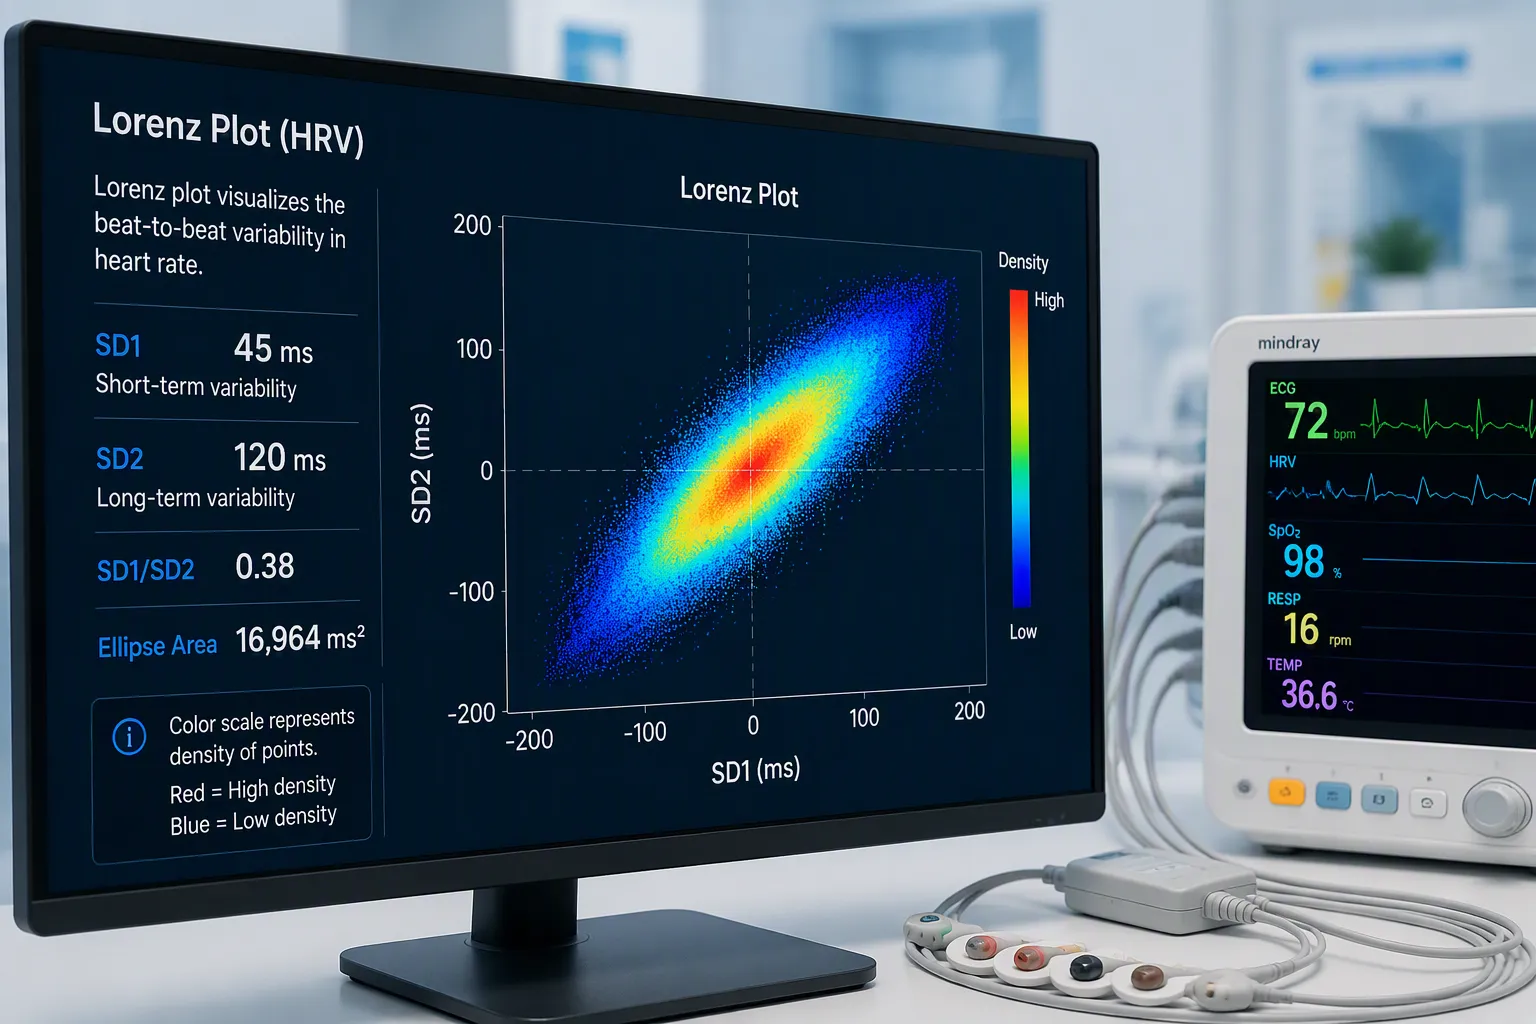
Once heartbeat intervals are plotted, different distributions can appear.
You may see a relatively compact, elongated shape, a broader distribution, or a more scattered pattern. These shapes are sometimes described using visual terms such as comet, torpedo, or fan.
Comet-Like Patterns
A broader, comet-like distribution generally reflects greater variability in the recorded heartbeat intervals.
In a healthy person, the exact shape can change with sleep stage, activity, breathing, and other physiological conditions. So a broader pattern should not automatically be interpreted as “good.” It is better understood as: There is a wider range of beat-to-beat variation in this recording.
The most useful question is often how that pattern compares with your own previous recordings.
Narrow or Torpedo-Like Patterns
A narrow, elongated distribution represents less variation in the recorded heartbeat intervals. This can occur under different physiological conditions and may be influenced by factors such as stress, activity, sleep, or other changes in the body.
A narrower pattern therefore should not automatically be interpreted as a sign of overtraining or poor health.
Instead, it can be a reason to look at the broader context:
Has your HRV changed compared with your normal baseline?
Did you sleep differently?
Was your training load higher?
Have your resting heart rate or other measurements changed?
Is the pattern persistent across multiple recordings?
This approach is much more useful than treating one shape as a definitive answer.
More Scattered or Irregular Patterns
Some recordings may produce a more widely scattered distribution.
This can happen for several reasons, including changes in heart rhythm, movement, measurement artifacts, or other physiological factors.
Certain abnormal heart rhythms can create distinctive patterns on a Poincaré plot, which is one reason these visualizations are also used in research and clinical contexts.
What HRV Rhythm Patterns Can Tell You
The value of a Lorenz plot is not that it gives you another “good” or “bad” score. Its value is that it shows distribution and structure.
Two recordings could produce similar average HRV values while having somewhat different underlying patterns. Looking at the visual distribution can therefore provide additional context.
Dispersion: Looking at the Width of the Pattern
One common way of describing a Poincaré plot is through SD1 and SD2. You do not need to understand all the mathematics to understand the basic idea.
SD1 describes short-term variability—the variation between nearby heartbeat intervals. SD2 describes longer-term variability across the broader recording. Together, they provide a way to describe how widely the points are distributed.
This is useful because HRV is not one-dimensional - a person can have relatively similar overall HRV values while showing differences in short-term versus longer-term variability.
What Should You Look For?
Rather than asking - “Is my plot wide enough?” look for changes relative to your own baseline. For example: Normal pattern → gradual change over several nights → persistent difference is more informative than: One unusual night → immediate conclusion. Sleep, exercise, stress, illness, alcohol, temperature, and many other factors can affect HRV.
A pattern that persists across multiple comparable measurements deserves more attention than a single unusual result.
Asymmetry: Another Layer of the Pattern
A Lorenz plot can also be examined for symmetry and asymmetry.
In simple terms, symmetry describes how evenly the points are distributed around the line of identity. Asymmetry means the distribution is more heavily concentrated on one side. This can provide additional information about the structure of heartbeat variability.
However, interpreting asymmetry as a direct measurement of “sympathetic dominance” or “parasympathetic dominance” is too simplistic.
The autonomic nervous system is complex, and HRV reflects multiple interacting physiological influences. A better way to think about asymmetry is: It provides another feature of the heartbeat pattern that can be compared across recordings and interpreted alongside other data. That is particularly useful when looking at trends rather than isolated readings.
Lorenz Plots, Irregular Rhythms, and Sleep
Can Lorenz Plots Show Irregular Heartbeats?
They can help visualize irregularities in heartbeat interval data.
When individual intervals differ substantially from the surrounding pattern, they may appear as points outside the main distribution. This is one reason Poincaré plots have been studied in relation to different heart rhythm patterns.
However, a visual outlier does not automatically tell you why it occurred. It could reflect:
A genuine change in heart rhythm
A missed or incorrectly detected beat
Movement artifact
Sensor noise
Another measurement issue
This is why wearable data is most valuable when viewed in context and alongside other health signals. By continuously monitoring heart-related data, CIRCUL Ring can help you identify patterns and changes over time, giving you a clearer picture of your personal health trends. While wearable data is not a substitute for professional medical evaluation, it can be a useful tool for staying informed and paying closer attention to changes in your body.
Why Nighttime Data Can Be Useful
Sleep provides a relatively stable environment for long-duration physiological monitoring. You are generally moving less than during the day, and there are fewer immediate influences such as exercise, work, meals, or active movement. That makes overnight data useful for establishing a consistent personal baseline. The goal is not to find one “perfect” nighttime Lorenz plot.
Instead, look at how your patterns change from night to night. For example: Night 1 → Night 2 → Night 3 → Night 4 can tell you much more about your personal pattern than one isolated measurement.
Sleep stages also affects autonomic activity, so overnight HRV naturally changes throughout the night. That is another reason not to interpret one particular shape as universally “healthy” or “unhealthy.”
Tracking Your Patterns with CIRCUL RING 2 MAX

Continuous Monitoring: The Key to Catching Subtle Shifts
The quality of any HRV pattern depends on the quality and continuity of the underlying heartbeat data.
The CIRCUL RING 2 MAX provides true 24/7 continuous monitoring of HR and HRV, allowing users to collect physiological data across sleep, rest, activity, and everyday life. This makes it possible to look beyond a single daily HRV number.
Instead, you can observe how your HRV changes across different conditions and over longer periods. That is particularly useful for personal baseline tracking.
The objective is not to collect the largest possible amount of data. It is to collect consistent data that can be interpreted in context.
Adaptive Fit and Sensor Stability
Continuous monitoring also places demands on the physical design of a wearable. The ring needs to stay comfortably positioned while you sleep, work, exercise, and move throughout the day.
The CIRCUL RING 2 MAX uses an Adaptive Sizing Structure designed to accommodate changes in finger circumference.
It is combined with SST™ Ultra 2.0, or Sensor Stabilization Technology, to support stable sensor positioning. Together with 3-Wavelength PPG, these components form the broader sensing system behind the ring.
The basic relationship is straightforward:
Adaptive fit
↓
More consistent positioning
↓
More stable sensor-to-skin contact
↓
A more consistent environment for optical sensing
These design elements work together to support consistent sensing throughout everyday wear, while factors such as movement, circulation, temperature, and individual physiology may naturally influence wearable measurements.
The Bigger Picture: HRV Is More Than a Score
HRV is often reduced to a single number because numbers are easy to understand, but the underlying signal is much richer.
Every heartbeat produces another interval, every interval relates to the one before it. And together, those intervals form a dynamic pattern that changes with your physiology.
A Lorenz plot gives you a way to see part of that pattern: it does not replace RMSSD or SDNN, it also does not diagnose a health condition.
What it does provide is another perspective: instead of only asking how much HRV you have, you can also look at how that variability is distributed. That distinction can make long-term HRV tracking more informative.
FAQ
How long do you need to wear a device to see meaningful Lorenz plot patterns?
There is no single wear time that guarantees a meaningful pattern.
A full night can provide a useful starting point because it gives you a longer, relatively stable recording period.
Tracking multiple nights can provide even more context, helping you understand your personal baseline, recognize recurring patterns, and identify changes over time.
Can a Lorenz plot diagnose heart conditions?
A Lorenz plot can visualize patterns in heartbeat interval data and may help highlight changes or irregularities that are worth paying attention to. CIRCUL provides this type of data as part of a broader approach to understanding your personal health trends.
While a Lorenz plot is not intended to replace professional medical evaluation, it can be a useful tool for observing your heart-related data and identifying patterns you may want to discuss with a healthcare professional.
What does a narrow or “torpedo” shape mean?
A narrow pattern generally represents less variability in the recorded heartbeat intervals.
This pattern can be influenced by many factors, including physiological state, stress, sleep, activity, and measurement conditions. The most useful approach is to view it in the context of your own baseline and follow how your patterns change over time.
With ongoing monitoring from CIRCUL, these patterns can provide additional context for understanding your personal heart-rate variability and overall wellness trends.
Is a wider Lorenz plot always healthier?
Not necessarily. A wider distribution indicates greater variation in the recorded heartbeat intervals, but HRV patterns are highly context-dependent.
Sleep stage, breathing, activity, age, fitness, and many other factors can influence the shape. Rather than viewing a wider or narrower pattern in isolation, comparing your current pattern with your own historical baseline can provide more meaningful context and help you understand how your HRV patterns change over time.
How does the CIRCUL RING 2 MAX support HRV pattern tracking?
The CIRCUL RING 2 MAX provides true 24/7 continuous monitoring of HR and HRV, giving you an ongoing stream of physiological data that can help you observe patterns and changes over time.
Its 3-Wavelength PPG, SST™ Ultra 2.0, and Adaptive Sizing Structure work together as part of the ring's sensing system, supporting consistent data collection throughout everyday wear.
Does the CIRCUL RING 2 MAX continuously monitor blood pressure too?
CIRCUL's approved terminology for this feature is blood pressure monitoring.
The ring's true 24/7 continuous monitoring claim applies specifically to HR, HRV, and Body Energy, while blood pressure is provided through the ring's blood pressure monitoring feature. This distinction helps clearly communicate how each type of health data is collected and presented in the CIRCUL app.
Can CIRCUL RING 2 MAX diagnose sleep apnea?
CIRCUL uses the term Sleep Apnea Risk Assessment to help users identify patterns associated with potential sleep apnea risk.
It is designed as a wellness-oriented assessment rather than a medical diagnosis, providing another layer of insight into your sleep and breathing patterns that can be viewed alongside your other health and wellness data.
The Bottom Line
RMSSD and SDNN help summarize different aspects of heart rate variability. A Lorenz plot adds another perspective by showing how successive heartbeat intervals relate to one another.
The real value comes from combining these measurements with context and, most importantly, your own long-term baseline.
The CIRCUL RING 2 MAX is designed for this kind of long-term observation, with true 24/7 continuous HR and HRV monitoring, alongside Body Energy and other wellness insights.
Instead of asking whether one HRV number is “good” or “bad,” you can start asking better questions: Is this different from my normal pattern? Has the change lasted? What else changed at the same time?
That shift—from chasing individual scores to understanding patterns—is one of the most useful ways to think about HRV.
Wellness Disclaimer
CIRCUL RING provides wellness and lifestyle insights and is not intended to diagnose, treat, cure, or prevent any disease or medical condition. Health measurements and insights should not replace professional medical advice, diagnosis, or treatment.